9月宏觀槓桿率跟蹤點評:緊信用向寬信用的過渡階段
本文來自格隆匯專欄: 中信債券明明,作者:明明債券研究團隊
核心觀點
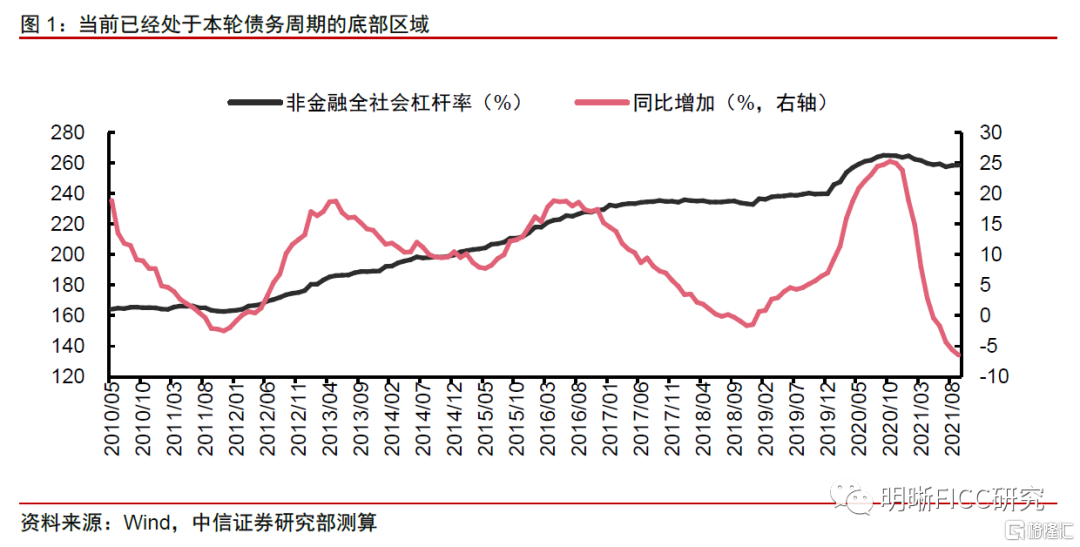
據我們測算,三季度宏觀槓桿率較二季度進一步回落0.8個百分點至264.6%,四季度大概率是本輪槓桿率底部,而槓桿結構上已經體現出逆週期的特徵。從央行鍼對通脹的判斷以及貨幣政策定調來看,短期滯脹可能難以成爲寬信用的掣肘。
據我們測算,三季度末國內社科院口徑宏觀槓桿率約爲264.6%,較二季度末進一步下降0.8個百分點,當前仍然處於本輪債務週期的下行階段。從月度變化來看,預計9月宏觀槓桿率環比增加0.2個百分點,但增幅弱於歷史季節性,同比增幅從上個月的-5.6個百分點進一步降至-6.4個百分點。從槓桿率下行幅度來看,當前已經處於歷次債務週期的底部區域。9月社融(分子端)和三季度GDP(分母端)雙雙弱於預期,但是結構性通脹支撐分母,使得宏觀槓桿率仍處於下行通道。類比庫存週期的階段劃分,我們可以認爲當前已經從主動去槓桿,進入被動去槓桿階段,體現爲分子端融資需求不足帶動社融下行,而分母端出現“類滯脹”現象,經濟產出“量縮價升”。
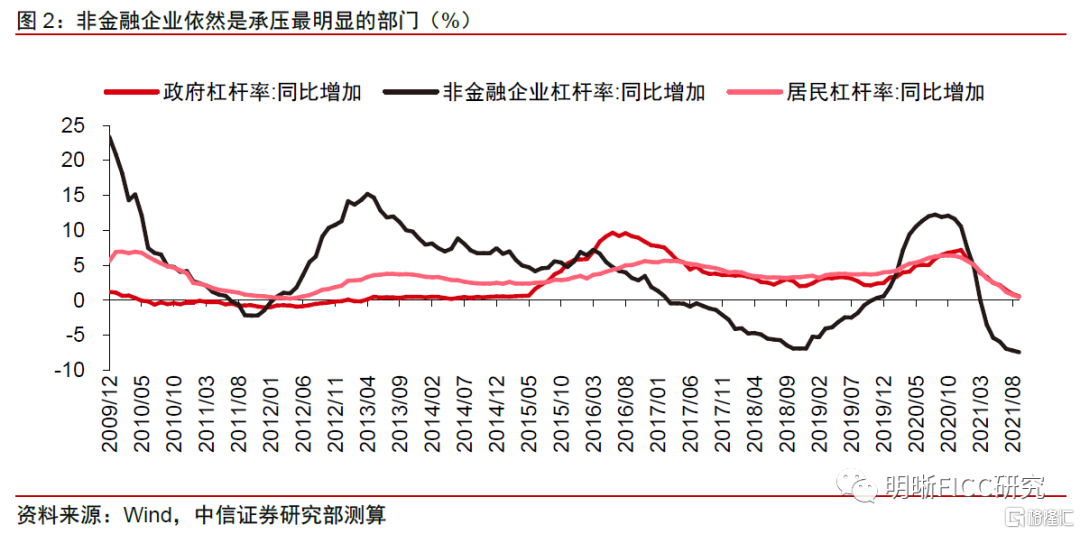
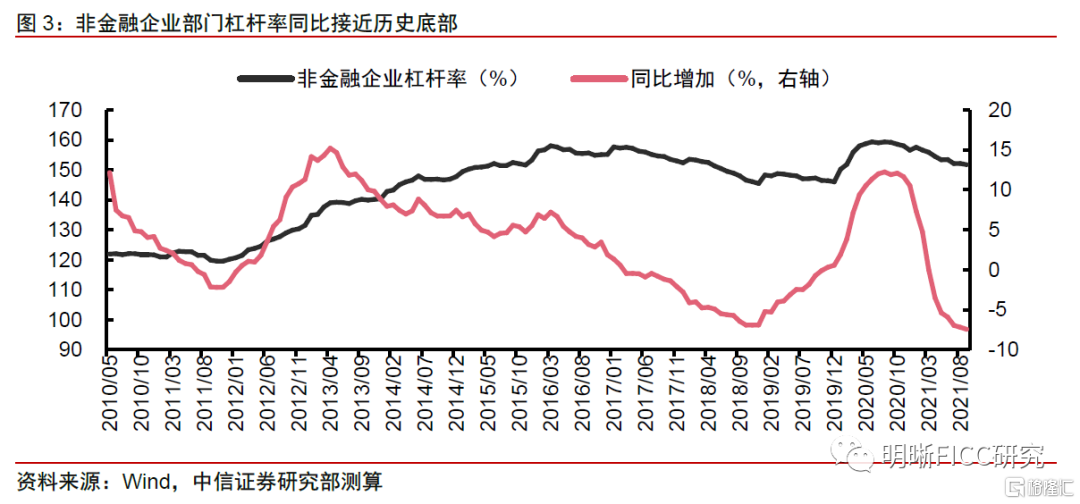
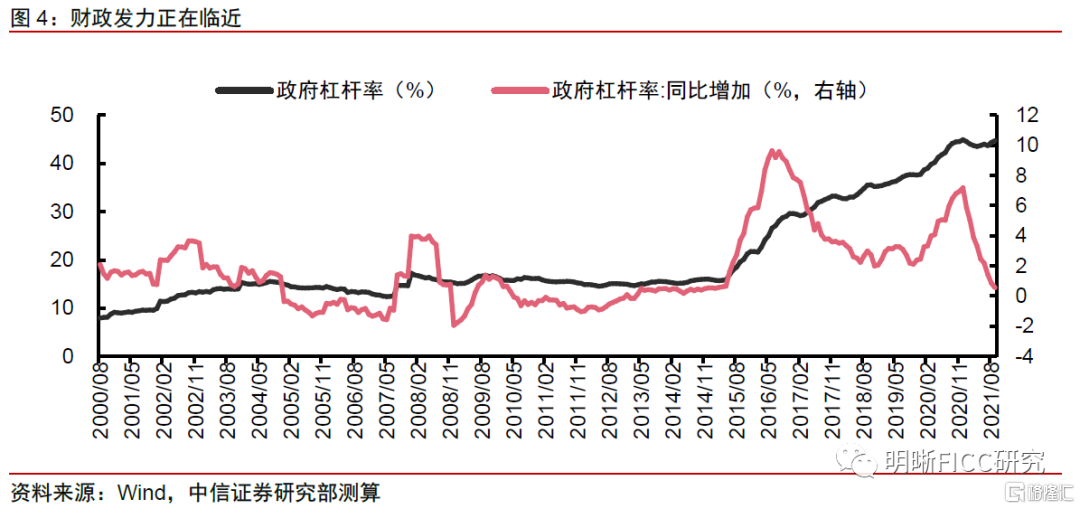
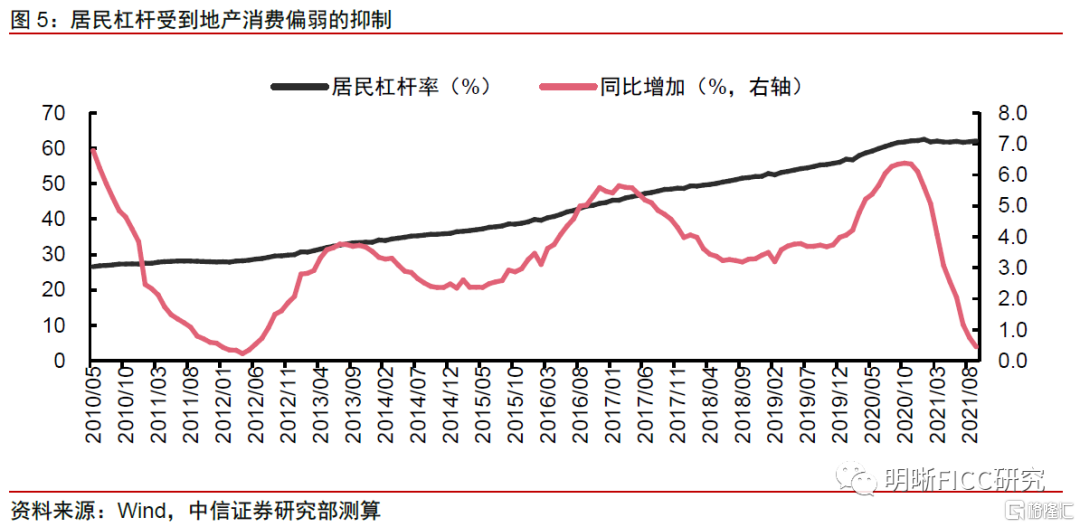
分部門來看,預計9月政府/居民/非金融企業部門槓桿率環比變化0.4/0.2/-0.4個百分點,企業部門是宏觀槓桿率的主要拖累項。政府部門槓桿率在年底專項債供給放量的背景下有所擡升,成爲社融和槓桿率的主要支撐項,金融數據的結構體現出逆週期特徵有所增強。居民部門方面,9月30大中城市商品房成交面積進一步下滑,帶動住戶貸款繼續偏弱。企業部門方面,9月各地限電限產對供求兩方面均造成衝擊,企業融資需求受到抑制,槓桿率下行幅度也最高。雖然9月份社融增速(10%)是今年以來最低,但三季度實際GDP增速回落幅度更大(至4.9%),即便有高通脹的支撐(9月PPI 10.7%),我們也看到宏觀槓桿率回落的幅度已經遠小於上半年。
本輪債務週期底部大概率出現在今年底,9月份可能是年內宏觀槓桿率同比的最低點,但是槓桿率絕對值的低點可能在年底。分項來看:1)社融增速四季度可能企穩回升。8·23央行貨幣信貸形勢分析座談會首提“增強信貸總量增長的穩定性”,顯示政策層已經將穩定信貸增速的考量提上日程,再加上年底專項債發行提速對社融的支撐,以及近期部分地區房地產政策的邊際放鬆,都可能助力社融增速的企穩回升;2)四季度實際GDP增速可能較三季度環比改善。三季度經濟受到極端天氣、疫情反覆和限電限產的多重衝擊,其中部分因素有望在四季度邊際改善,疊加近期地產和信貸相關政策的邊際放鬆,四季度經濟增長可能較三季度出現改善;3)四季度通脹水平在商品供應緊缺的背景下可能仍然居高不下,PPI可能向CPI傳導。
短期滯脹是否會成爲寬信用的掣肘?政策在滯脹環境下面對的問題是,如何在不刺激通脹的前提下實現穩增長,傳統上寬鬆的貨幣政策和財政政策都會對增長和通脹形成同向影響。美林時鐘建議在滯脹階段增配現金,因爲貨幣主義給出的對策是通過緊縮的貨幣政策限制通脹,經濟增長會自然好起來。但這和當前貨幣政策選擇並不一致。第一,本輪滯脹更多是短期的,孫國峯司長在8·23央行貨幣信貸形勢分析座談會上表示“PPI有望於今年底至明年趨於回落”,因此對貨幣政策影響有限;第二,本輪滯脹受到供給端約束且具有輸入性特點,而上述因素不能通過貨幣政策解決;第三,央行在公開表態上繼續保持貨幣政策穩健中性,如在前述會議上表示“銀行體系流動性供求將繼續保持基本平衡”以及“增強信貸總量增長的穩定性”。因爲我們傾向於認爲這一輪短期滯脹可能難以成爲寬信用的掣肘。
風險因素:模型測算結果可能與實際數據有誤差;貨幣政策超預期收緊。
圖表附錄
Follow us
Find us on
Facebook,
Twitter ,
Instagram, and
YouTube or frequent updates on all things investing.Have a financial topic you would like to discuss? Head over to the
uSMART Community to share your thoughts and insights about the market! Click the picture below to download and explore uSMART app!

Disclaimers
uSmart Securities Limited (“uSmart”) is based on its internal research and public third party information in preparation of this article. Although uSmart uses its best endeavours to ensure the content of this article is accurate, uSmart does not guarantee the accuracy, timeliness or completeness of the information of this article and is not responsible for any views/opinions/comments in this article. Opinions, forecasts and estimations reflect uSmart’s assessment as of the date of this article and are subject to change. uSmart has no obligation to notify you or anyone of any such changes. You must make independent analysis and judgment on any matters involved in this article. uSmart and any directors, officers, employees or agents of uSmart will not be liable for any loss or damage suffered by any person in reliance on any representation or omission in the content of this article. The content of the article is for reference only and does not constitute any offer, solicitation, recommendation, opinion or guarantee of any securities, virtual assets, financial products or instruments. Regulatory authorities may restrict the trading of virtual asset-related ETFs to only investors who meet specified requirements. Any calculations or images in the article are for illustrative purposes only.
Investment involves risks and the value and income from securities may rise or fall. Past performance is not indicative of future performance. Please carefully consider your personal risk tolerance, and consult independent professional advice if necessary.