賽靈藥業深市主板IPO:年入3.12億元,單一依賴核心產品
據格隆匯新股瞭解,賽靈藥業科技集團股份有限公司(以下簡稱“賽靈藥業”)日前向證監會遞交上市招股書,擬登陸深市主板,民生證券為其保薦人。
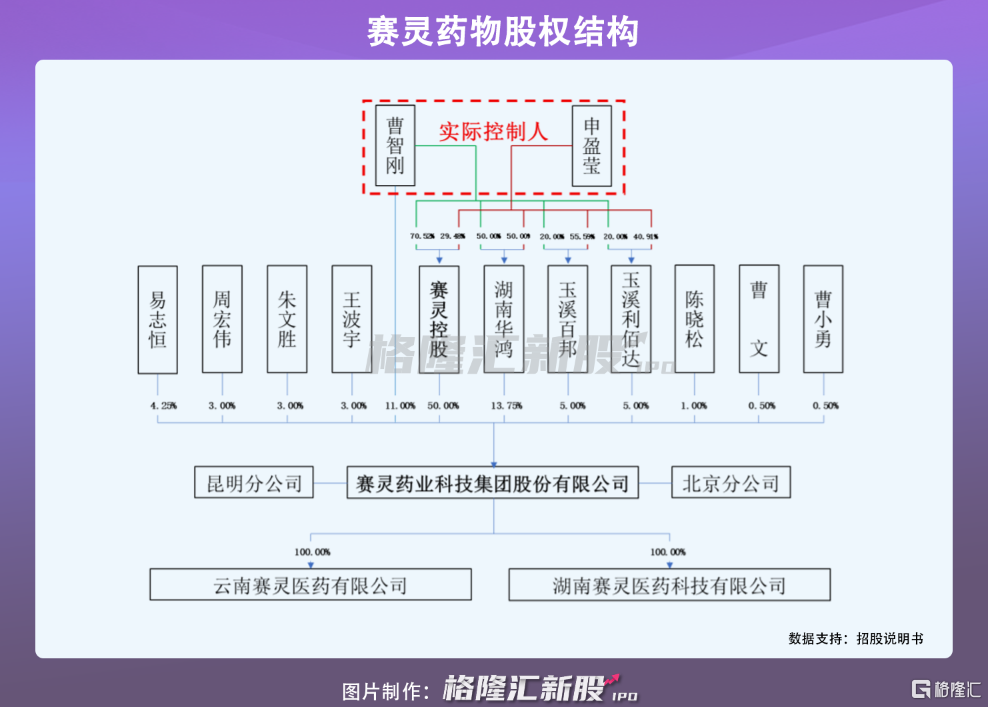
IPO前,賽靈投資持有發行人50%的股份,是公司的控股股東;曹智剛直接持有公司11.00%股份,與其配偶申盈瑩通過賽靈控股間接持有公司50.00%股份,與其配偶申盈瑩通過湖南華鴻、玉溪百邦、玉溪利佰達間接控制公司部分股份,二人合計控制公司84.75%股份,系公司實際控制人。
1
核心產品貢獻收入超7成
賽靈藥業主營業務為中成藥的研發、生產及銷售,主要產品為恆古骨傷癒合劑。除此之外,公司於2020年8月收購了湖南賽靈科技,開始經營醫藥商業業務,主要在湖南省開展碳酸鈣D3片及顆粒、腫節風分散片等醫藥品種的代理批發業務。
2018年-2020年,公司營收及利潤不斷增長,實現營收由1.62億元增長至3.12億元,年複合增長率為14.14%;相對應的歸母淨利潤則由1987.53萬元增長至6187.54萬元,年複合增長率高達76.44%。
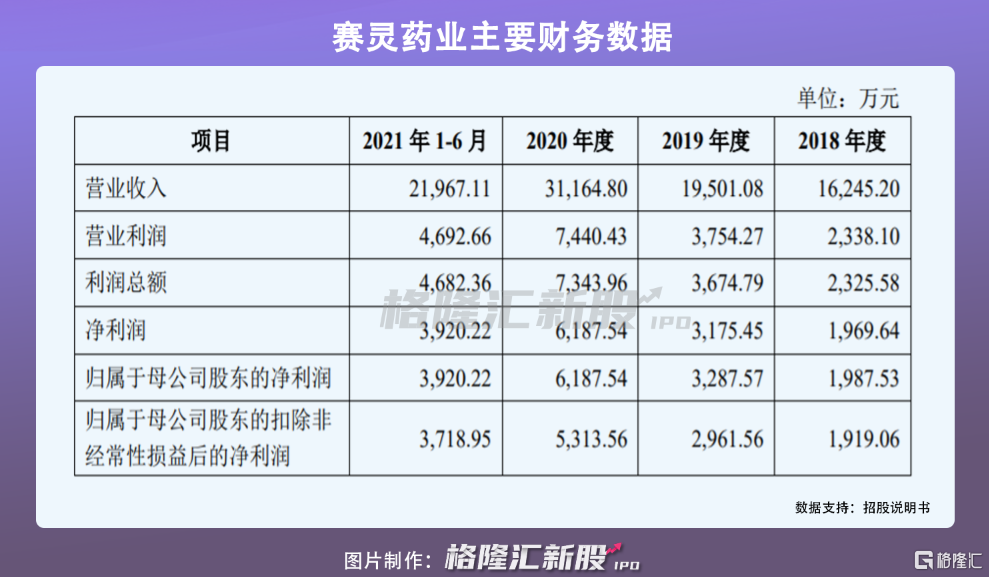
分業務來看,由於醫藥商業業務2020年才收購,因此該業務整體規模較小,佔營收比重不到25%。而醫藥工業業務為其第一大業務,其中恆古骨傷癒合劑為其第一大產品,2018年-2020年,實現收入由1.62億元增長至2.39億元,儘管公司已經開始開拓其他業務板塊及產品,恆古骨傷癒合劑收入佔比也由99%下降至77%,但不可否認,公司仍存在單一產品依賴的風險。
值得注意的是,恆古骨傷癒合劑主要用於治療新鮮骨折及陳舊骨折、股骨頭壞死、骨關節病、腰椎間盤突出症,屬於骨骼肌肉系統疾病中成藥。而近年來,中國骨骼肌肉系統疾病用藥整體市場銷售額呈現波動態勢,2020年受疫情影響,市場規模下降至747.29億元。
可以看到,骨骼肌肉系統疾病中成藥規模不斷萎縮,由2017年的360.70億元持續下降至2020年的336.41億元,且一直低於化學藥市場規模。
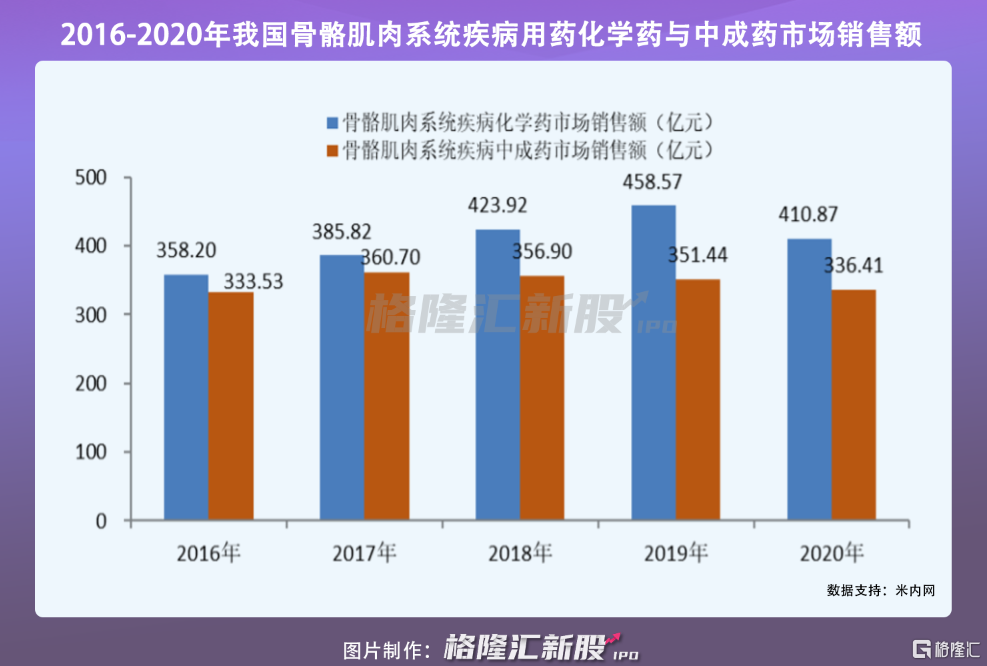
在此背景下,即便恆古骨傷癒合劑的市佔率有所提升,由3.95%提升至4.91%,也難以保證其未來收入規模持續穩定增長。
2
新增產能如何消化?
此次上市,賽靈藥業計劃募集資金約4.4億元,其中1.26億元投向於藥品生產基地建設項目、1.38億元投向於研發中心建設項目、7723萬元用於品牌提升於營銷網絡建設項目,9900萬元則用於骨健康系列藥品研發項目。
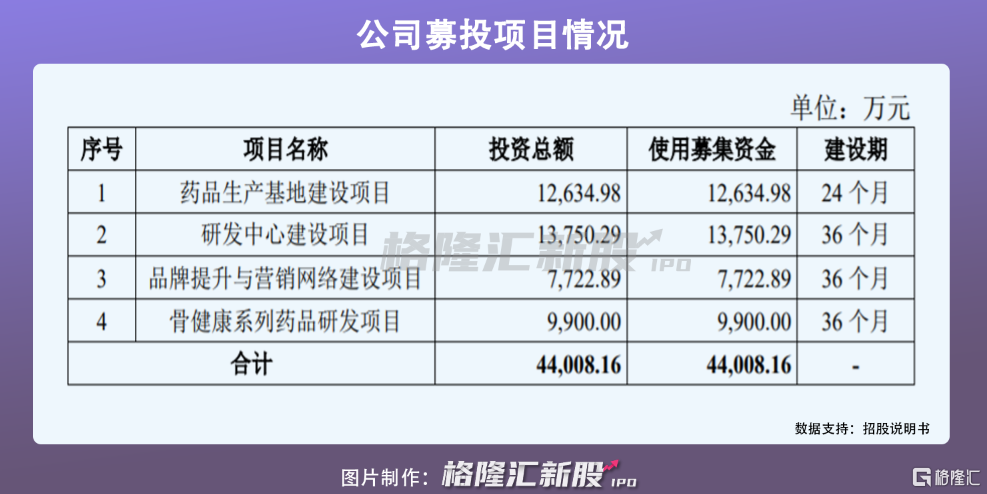
值得注意的是,此次藥品生產基地建設項目計劃新建田七鎮痛膏和藍芩顆粒兩條生產線,順利建成後每年新增田七鎮痛膏1.9億片、藍芩顆粒1.3億袋。
而目前,公司尚未銷售過田七鎮痛膏,對其銷售成效尚不能評斷;藍芩顆粒的銷售收入規模也不足500萬元,以上半年銷售437.32萬元藍芩顆粒,每袋以1.6元來推算,半年銷量約在273萬袋,而此次投入後,1.3億袋的藍芩顆粒產能將如何消化?
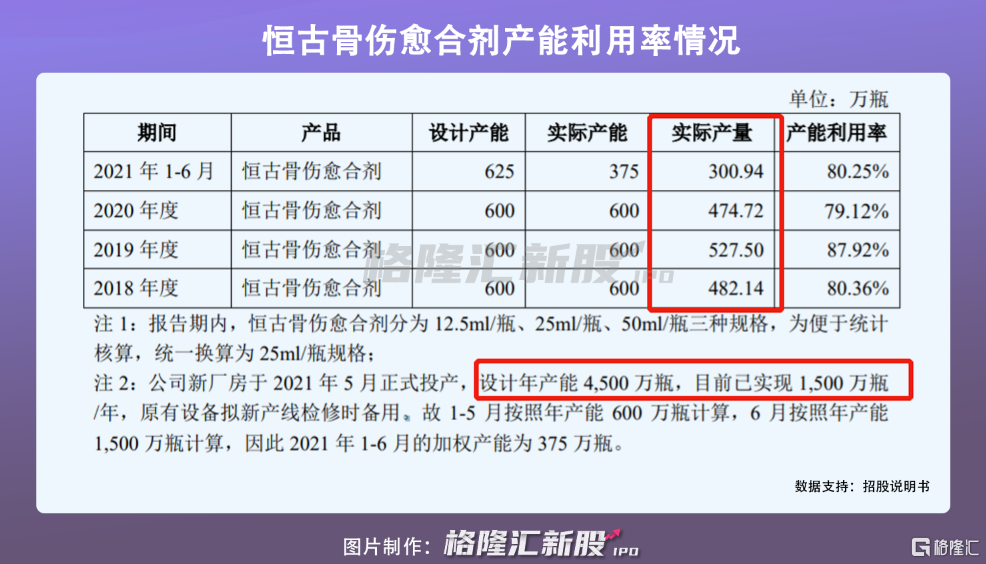
就連核心產品恆古骨傷癒合劑亦是如此。該產品近3年以來,年實際產量在500萬瓶左右,產能利用利率尚未打滿,大部分時候在80%左右,而隨着新廠房逐漸投產,設計年產能將達到4500萬瓶,遠遠高於現有產能及產量輸出。
儘管,賽靈藥業擬加大品牌提升與營銷網絡建設,擴大未來銷售渠道,但此次新增產能規模較大,其業務拓展具有不確定性。若不能及時消化新增產能,不僅將對其預期收益產生不利影響,還將面對大量存貨堆積帶來的存貨減值壓力。
3
小結
近年來,賽靈藥業整體財務狀況呈現良好的發展態勢,但依然存在不少問題值得關注,譬如營收依賴於單一產品、核心產品市場規模不斷萎縮、新增產能如何消化等問題,或將阻礙其上市之路。
Follow us
Find us on
Facebook,
Twitter ,
Instagram, and
YouTube or frequent updates on all things investing.Have a financial topic you would like to discuss? Head over to the
uSMART Community to share your thoughts and insights about the market! Click the picture below to download and explore uSMART app!

Disclaimers
uSmart Securities Limited (“uSmart”) is based on its internal research and public third party information in preparation of this article. Although uSmart uses its best endeavours to ensure the content of this article is accurate, uSmart does not guarantee the accuracy, timeliness or completeness of the information of this article and is not responsible for any views/opinions/comments in this article. Opinions, forecasts and estimations reflect uSmart’s assessment as of the date of this article and are subject to change. uSmart has no obligation to notify you or anyone of any such changes. You must make independent analysis and judgment on any matters involved in this article. uSmart and any directors, officers, employees or agents of uSmart will not be liable for any loss or damage suffered by any person in reliance on any representation or omission in the content of this article. The content of the article is for reference only and does not constitute any offer, solicitation, recommendation, opinion or guarantee of any securities, virtual assets, financial products or instruments. Regulatory authorities may restrict the trading of virtual asset-related ETFs to only investors who meet specified requirements. Any calculations or images in the article are for illustrative purposes only.
Investment involves risks and the value and income from securities may rise or fall. Past performance is not indicative of future performance. Please carefully consider your personal risk tolerance, and consult independent professional advice if necessary.