國博電子擬登陸科創板,聚焦國產射頻芯片,依賴於前五大客户
近日,南京國博電子股份有限公司(以下簡稱“國博電子”)衝擊科創板IPO,保薦人為招商證券。
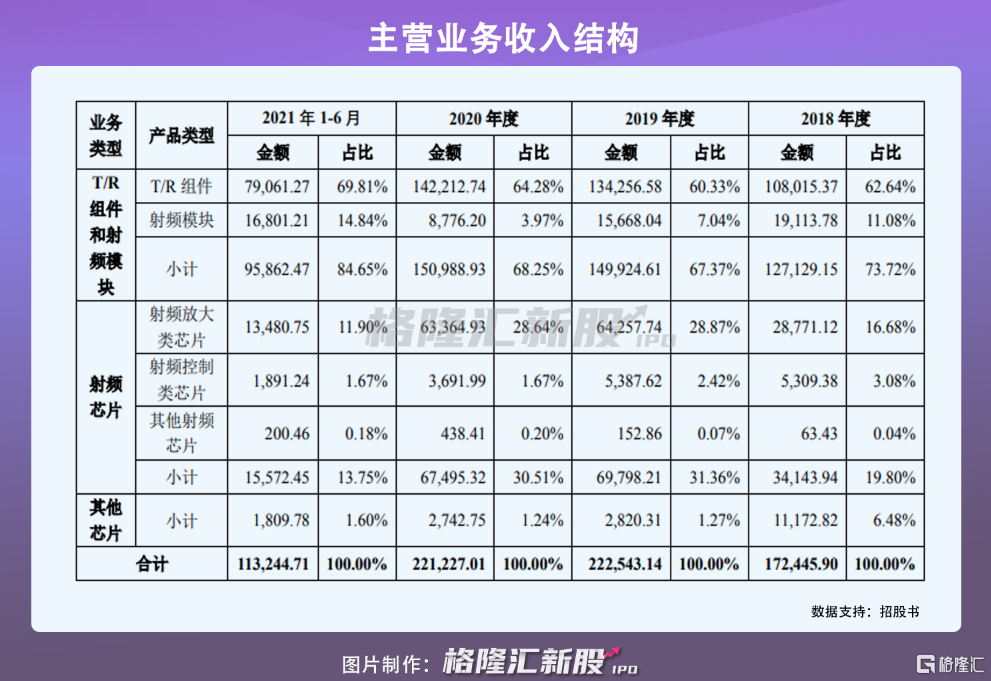
國博電子主要從事有源相控陣 T/R 組件和射頻集成電路相關產品的研發、生產和銷售,產品主要包括有源相控陣 T/R 組件、砷化鎵基站射頻集成電路等,覆蓋軍用與民用領域,是目前國內能夠批量提供有源相控陣 T/R 組件及系列化射頻集成電路相關產品的領先企業。
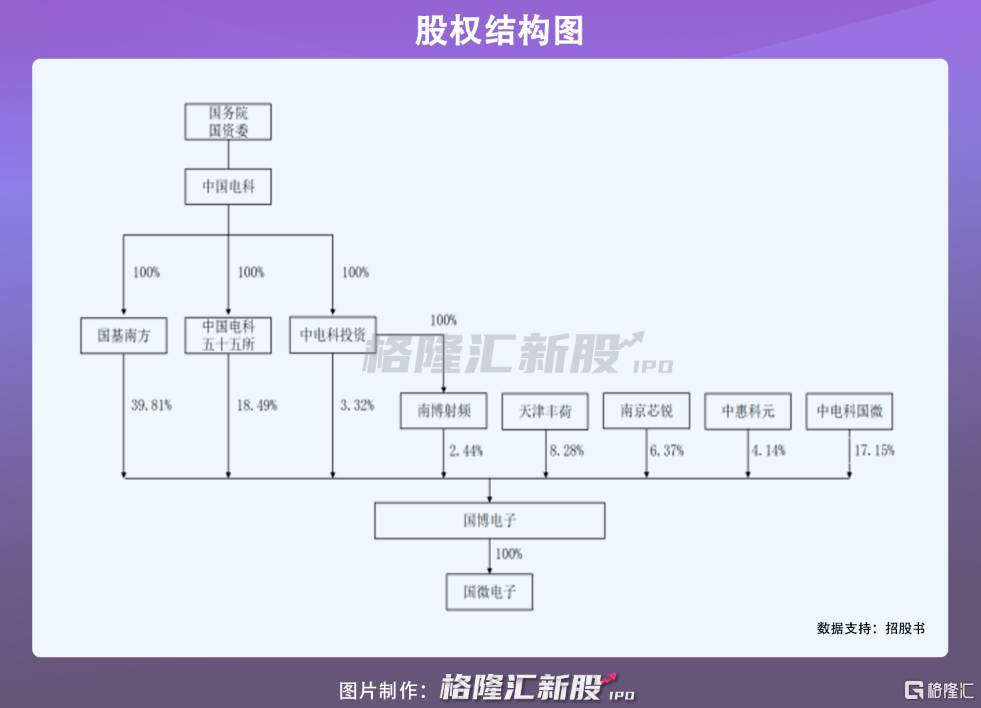
根據招股書,公司直接控股股東為國基南方,持有公司 39.81%的股份。中國電科通過國基南方、中國電科五十五所和中電科投資間接控制公司61.62%的股份,為公司實際控制人。
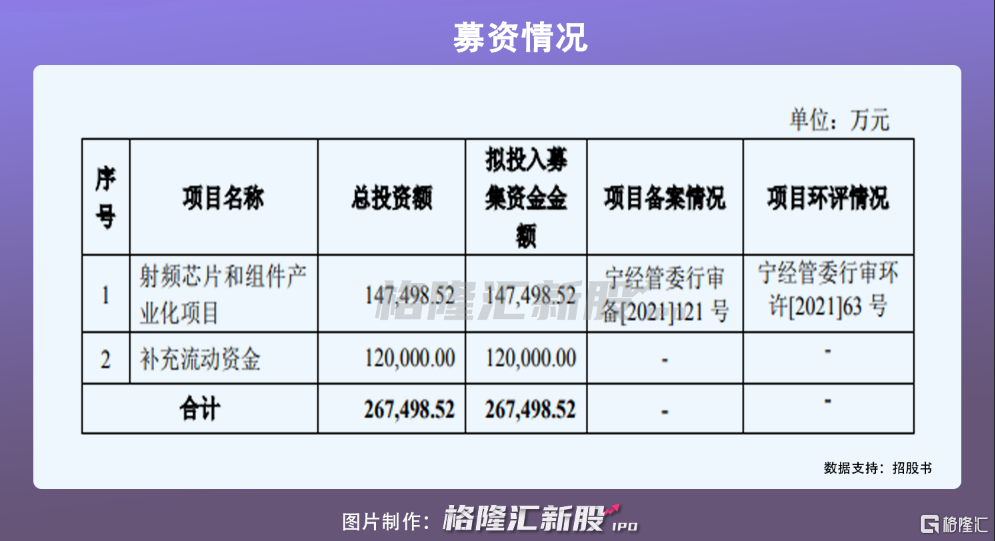
本次IPO擬募集資金26.75億元,主要用於射頻芯片和組件產品化項目、補充流動資金等。
1
2020年營收超22億元
隨着經濟的不斷髮展和對於科技創新的重視,中國已逐漸成為全球最大的電子產品生產及消費市場。公開數據顯示,中國模擬集成電路規模由 2012 年的 1368.5億元增至2019年的 2158 億元,年均複合增長率達 6.72%。中國模擬集成電路市場約佔全球市場的36%,已成為全球模擬集成電路需求最大的市場。
國博電子的 T/R 組件產品和射頻集成電路產品屬於模擬集成電路分類下的專用模擬集成電路和信號鏈集成電路,存在發展機遇。
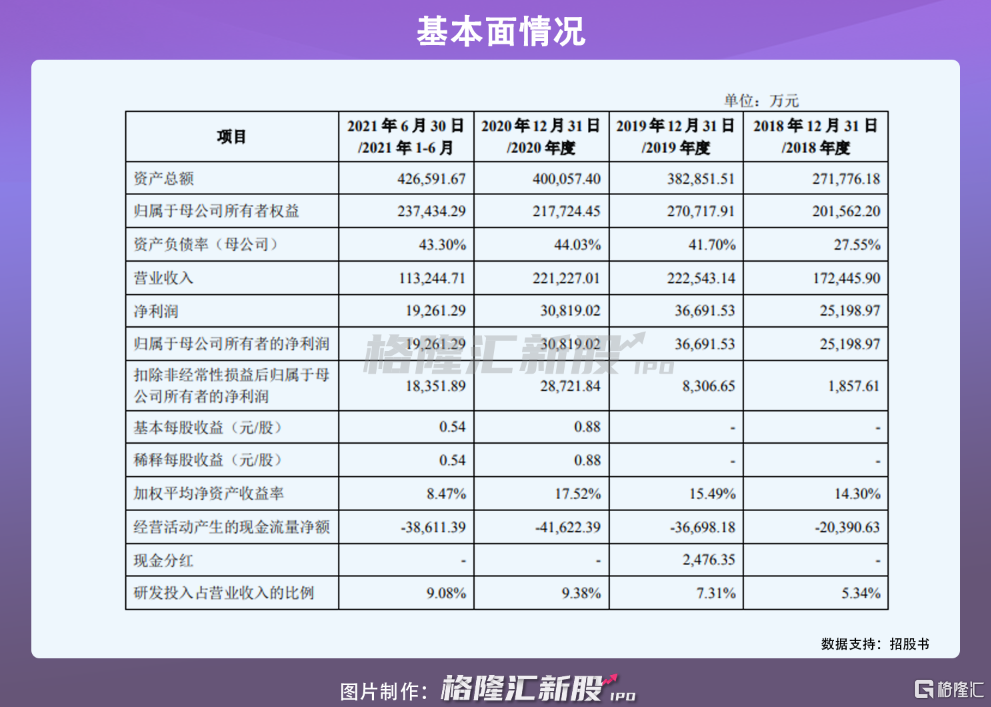
從基本面來看,國博電子實現營收分別為17.24億元、22.25億元、22.12億元、11.32億元,歸屬於母公司所有者的淨利潤2.52億元、3.67億元、3.08億元、1.93億元。
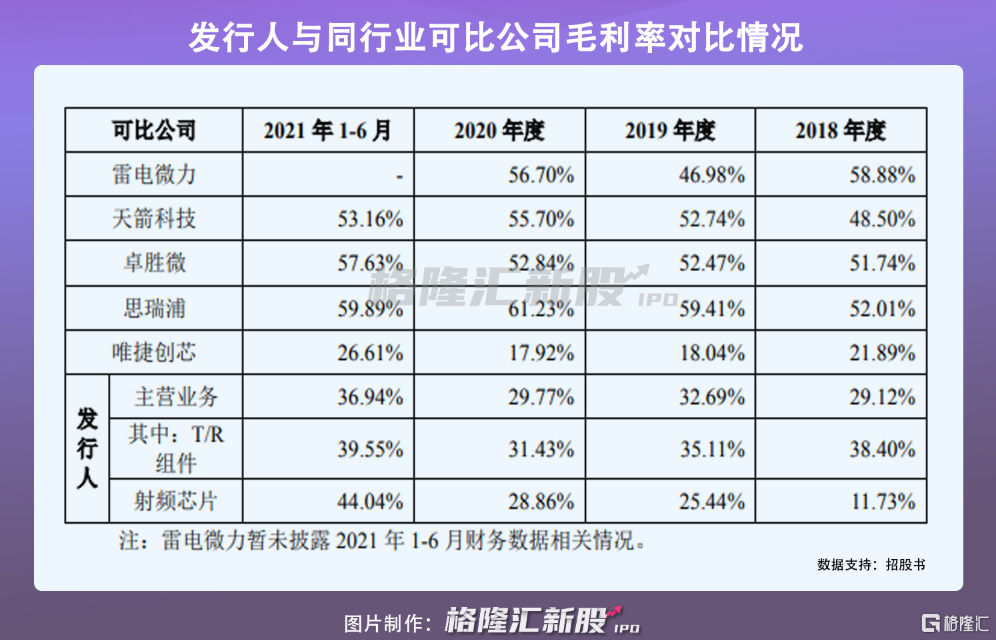
值得注意的是,國博電子的主營業務毛利率分別為29.12%、32.69%、29.77%、36.94%。可以發現,這一毛利率高於唯捷創芯,低於其他同行業可比公司,主要原因系產品結構、產品終端應用等差異導致。
同時,國博電子的主要產品包主要應用於相控陣雷達等軍用領域以及通信基站等民用領域,其技術和產品具有更新迭代較快等特點。為滿足下游客户不斷變化的需求,客觀上要求公司能夠抓住行業和技術發展趨勢,把握客户需求變動方向,及時推出滿足客户需求的新產品。
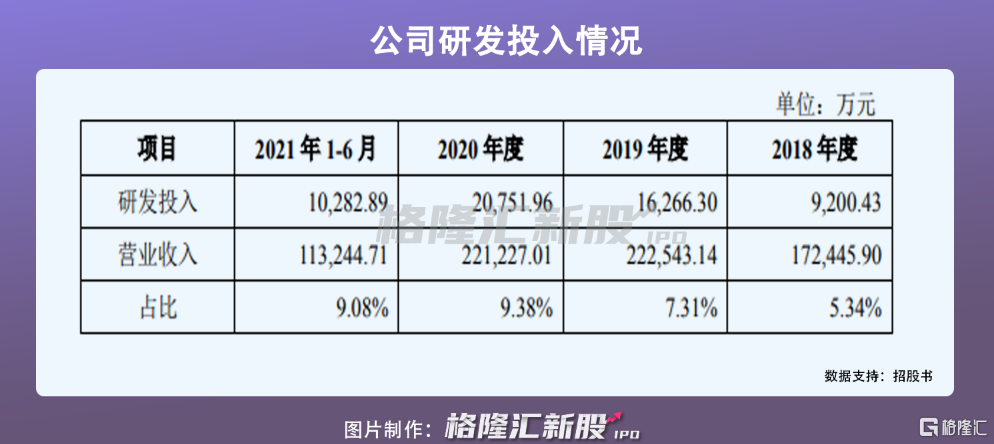
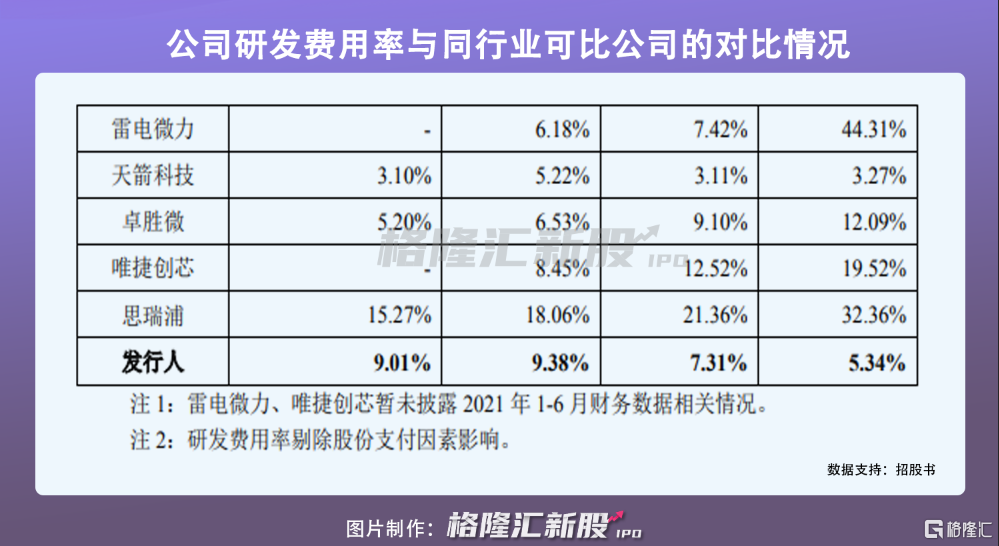
報吿期內,其研發費用分別為 9200.43萬元、1.63億元、2.08億元、1.03億元,佔同期營業收入的比例分別為 5.34%、7.31%、9.38%、9.08%,還有一定的提升空間。
2
依賴於前五大客户
國博電子的客户相對集中,主要系下游客户的行業分佈較為集中導致,主要為各大軍工集團下屬科研院所或整機單位、B 公司及其關聯方,其中,在民品領域,現階段國博電子射頻集成電路產品主要應用於移動通信基站。而我國移動通信設備製造商數量較少,導致客户集中。
報吿期內,公司前五大客户的銷售收入金額分別為14.60億元、20.59億元、19.72億元、10.81億元,佔當期營業收入的比例分別為 84.68%、92.53%、89.15%和 95.48%。如果未來公司主要客户的採購、經營戰略發生較大變化,或因技術原因等因素無法滿足客户的需求,則經營業績或將面臨下降或增速放緩的風險。
此外,報吿期各期末,國博電子的應收票據餘額分別為 8.58億元、7.72億元、4.66億元、4.44億元,應收賬款餘額分別為7.31億元、14.53億元、12.41億元、19.22億元。
報吿期各期末,經營性應收款項餘額較大,主要系大型軍工客户結算方式導致,大型軍工客户一般按照背靠背的方式進行結算,即下游客户回款後向上游供應商進行結算。報吿期內,公司經營性應收款項回款良好。但是,其經營性應收款項金額較大,佔總資產比重較高,如果部分客户出現支付困難或者長期拖欠款項,將對發行人產生不利影響。
報吿期內,公司經營活動現金流量淨額分別為-2.04億元、-3.67億元、-4.16億元、-3.86億元,公司經營活動現金流量淨額持續為負,主要系公司軍工客户結算週期較長,且收款方式中部分採用票據結算;同時,其採購規模較大,供應商的付款信用期一般短於銷售收款週期,導致經營活動現金流入小於經營活動現金流出。如未來公司經營活動現金流量淨額為負的情況不能得到有效改善,營運資金的週轉可能會存在一定的風險。
3
結語
目前中國模擬集成電路的自給率約為 12%,仍有廣闊的成長空間,相比於數字集成電路,中國模擬集成電路的發展相對落後。但近年來,隨着國內半導體行業的快速發展,國內模擬集成電路企業也開始快速增長,目前國博電子需要通過新項目的擴建提升研發生產能力,儲備新技術,豐富產品數量,增強後續發展潛力,以滿足市場快速增長的需求。
Follow us
Find us on
Facebook,
Twitter ,
Instagram, and
YouTube or frequent updates on all things investing.Have a financial topic you would like to discuss? Head over to the
uSMART Community to share your thoughts and insights about the market! Click the picture below to download and explore uSMART app!

Disclaimers
uSmart Securities Limited (“uSmart”) is based on its internal research and public third party information in preparation of this article. Although uSmart uses its best endeavours to ensure the content of this article is accurate, uSmart does not guarantee the accuracy, timeliness or completeness of the information of this article and is not responsible for any views/opinions/comments in this article. Opinions, forecasts and estimations reflect uSmart’s assessment as of the date of this article and are subject to change. uSmart has no obligation to notify you or anyone of any such changes. You must make independent analysis and judgment on any matters involved in this article. uSmart and any directors, officers, employees or agents of uSmart will not be liable for any loss or damage suffered by any person in reliance on any representation or omission in the content of this article. The content of the article is for reference only and does not constitute any offer, solicitation, recommendation, opinion or guarantee of any securities, virtual assets, financial products or instruments. Regulatory authorities may restrict the trading of virtual asset-related ETFs to only investors who meet specified requirements. Any calculations or images in the article are for illustrative purposes only.
Investment involves risks and the value and income from securities may rise or fall. Past performance is not indicative of future performance. Please carefully consider your personal risk tolerance, and consult independent professional advice if necessary.