維嘉科技創業板IPO,擬募資11.3億元,聚焦PCB鑽孔及成型專用設備
近日,深圳證券交易所上市委員會收到蘇州維嘉科技股份有限公司(以下簡稱“維嘉科技”)第二輪問詢函意見回覆,中金公司爲其保薦機構。維嘉科技本次擬募集資金11.3億元,擬發行股數不超過1,207.14萬股,佔發行後總股本的比例不低於25%。
根據招股書顯示,邱四軍直接持有公司股份的比例爲44.97%,並通過維嘉凱悅間接控制公司15.78%的股份。邱四軍直接及間接控制公司股份的合計比例爲60.75%,爲公司的控股股東、實際控制人。
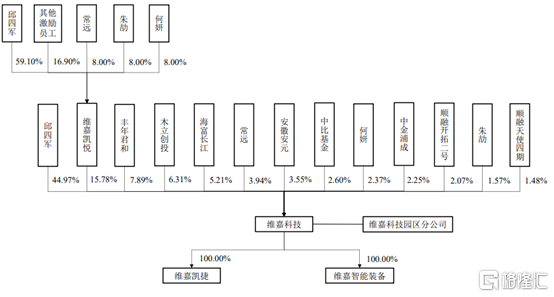
公司股權結構,圖源,招股書
1
綜合毛利率低於同行
公司專注於PCB核心設備—鑽孔及成型專用設備,以及其他專用設備的研發、生產和銷售,產品包括PCB鑽孔設備及PCB成型設備,應用於5G通信、智能終端、集成電路、汽車電子、雲計算、醫療電子及航空航天等領域。
2018年至2021年1-9月,維嘉科技營業收入分別爲2.34億元、2.30億元、4.81億元和6.00億元,扣非後歸母淨利潤分別爲1497.22萬元、1704.19萬元、5542.82萬元和7117.67萬元。營業收入和淨利潤增長主要原因是5G通信、智能終端、集成電路、汽車電子及雲計算等新興產業拉動PCB行業的產品需求大幅增長及業務規模持續擴大。
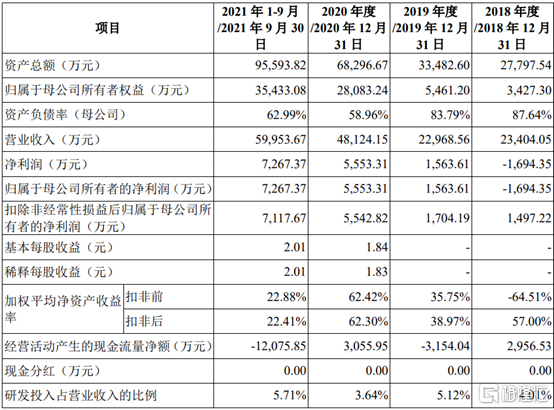
2018年至2021年1-9月公司主要核心財務,圖源,招股書
報告期內,公司綜合毛利率分別爲24.72%、27.28%、26.87%和27.81%,毛利率波動較大,主要原因是PCB設備的毛利率在不同的年份毛利率有一定差異,以致綜合毛利率在不同年份有所不同。
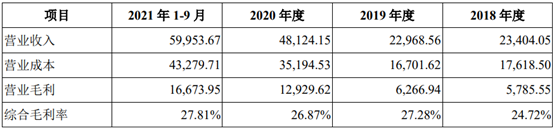
2018年至2021年1-9月公司綜合毛利率,圖源,招股書
報告期內,同行業可比公司綜合毛利率分別爲44.64%、44.50%、41.65%和42.78%,具體來看,2018年至2021年1-9月,公司綜合毛利率低於同行業可比公司。
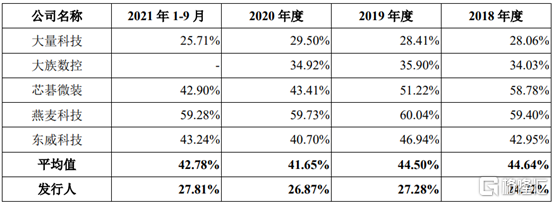
2018年至2021年1-9月公司與同行業可比公司綜合毛利率比較,圖源,招股書
2
季節性應收佔比波動大
報告期內,PCB專用設備行業公司的收入確認存在季節性特徵,下半年確認收入佔比較高,主要原因是下遊PCB生產企業通常在上半年制定當年的項目擴產投資計劃,期間陸續經過採購、安裝、調試等流程,於下半年對設備進行驗收。2018年、2019年和2020年,公司三、四季度合計主營業務收入分別爲1.25億元、1.35億元及3.45億元,佔比主營業務收入分別爲54.79%、60.10%和72.91%。主營業務收入季節性波動將增加公司執行生產計劃、資金使用等運營難度,進而對公司的發展造成不利的影響。
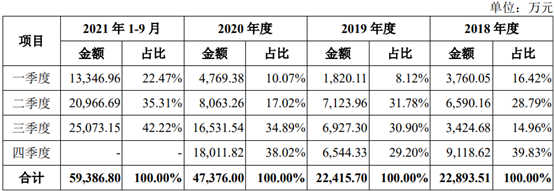
2018年至2021年1-9月公司主營業務收入按季度列示,圖源,招股書
3
依賴境內業務
報告期內,公司主要收入來自於境內客戶,境內收入佔主營業務收入分別爲2.21億元、2.13億元、4.62億元及5.76億元,境內主營業務收入佔比分別爲96.62%、94.81%、97.61%和97.06%,境外收入佔比分別爲3.38%、5.19%、2.39%和2.94%。公司境內客戶集中在華南、華東和華中地區,合計收入佔比分別爲92.01%、90.95%、96.41%和94.17%,與PCB產業地域分佈相匹配。境外客戶主要分佈在韓國、意大利、中國臺灣等。公司境內以外的業務仍處於開拓期,未來若以境內爲核心的華南、華中地區的PCB設備需求下降或市場競爭加劇,可能對公司的經營業績產生不利影響。
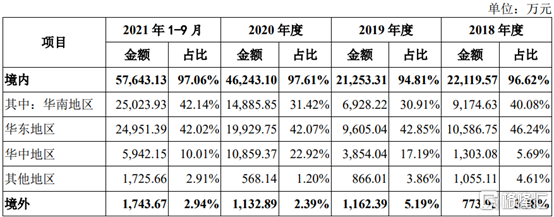
2018年至2021年1-9月公司主營業務收入按地區列示,圖源,招股書
4
小結
近年來,在5G通信、智能終端、集成電路、汽車電子等行業高速發展與國家政策的驅動下,PCB行業發展穩定。維嘉科技致力於PCB鑽孔及成型專用設備,可以滿足國內外不同客戶的需求,但季節性營收佔比波動大等問題仍是公司痛點所在,需要加大力度進行營收管理,從而提升公司在PCB行業中的長期可持續性發展。
Follow us
Find us on
Facebook,
Twitter ,
Instagram, and
YouTube or frequent updates on all things investing.Have a financial topic you would like to discuss? Head over to the
uSMART Community to share your thoughts and insights about the market! Click the picture below to download and explore uSMART app!

Disclaimers
uSmart Securities Limited (“uSmart”) is based on its internal research and public third party information in preparation of this article. Although uSmart uses its best endeavours to ensure the content of this article is accurate, uSmart does not guarantee the accuracy, timeliness or completeness of the information of this article and is not responsible for any views/opinions/comments in this article. Opinions, forecasts and estimations reflect uSmart’s assessment as of the date of this article and are subject to change. uSmart has no obligation to notify you or anyone of any such changes. You must make independent analysis and judgment on any matters involved in this article. uSmart and any directors, officers, employees or agents of uSmart will not be liable for any loss or damage suffered by any person in reliance on any representation or omission in the content of this article. The content of the article is for reference only and does not constitute any offer, solicitation, recommendation, opinion or guarantee of any securities, virtual assets, financial products or instruments. Regulatory authorities may restrict the trading of virtual asset-related ETFs to only investors who meet specified requirements. Any calculations or images in the article are for illustrative purposes only.
Investment involves risks and the value and income from securities may rise or fall. Past performance is not indicative of future performance. Please carefully consider your personal risk tolerance, and consult independent professional advice if necessary.