全球芯片Top10巨头最新排名:美国包揽前三,华为跌出前十,英伟达增幅最大
来源:TrendForce、新智元
【导读】据集邦科技(TrendForce)旗下拓墣产业研究院最新的数据显示,2020年Q3全球前十大IC设计公司营收排名出炉,在公布的《全球前十大IC设计公司营收排名》上,高通、博通和英伟达排名前三,华为遗憾地跌出前十名。
据拓墣产业研究院发布的排名显示,高通公司2020年Q3季度的营收规模达到了49.67亿美元,相比去年同期增长了37.6%,排名第二的则是博通,营收46.26亿美元,英伟达、联发科、AMD等则分别排在三四五位。
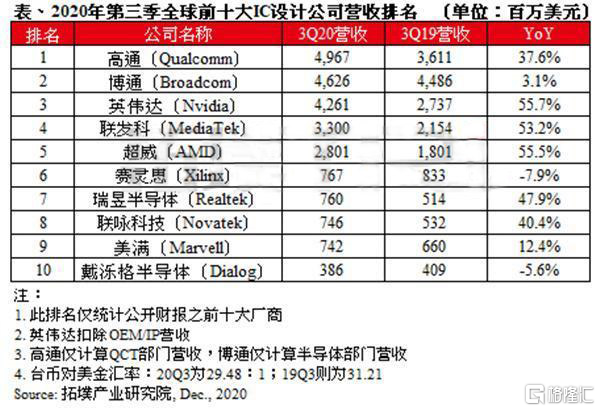
高通公司这次得益于苹果新机iPhone12系列的热卖和重新回归苹果供应链,叠加上因疫情而导致的客户积极拉货,以及5G射频元件产品逐渐开始贡献营收,使高通5G Modem与无线射频芯片需求大幅上升,故高通重新夺回全球第一的宝座。
排名第二的博通公司第三季营收年成长3.1%,摆脱了连续六个季度衰退的趋势,同样受益于需求端的变化,同时也是苹果新机的芯片供应商之一,一定程度上抵消了中美贸易摩擦带来的冲击。
英伟达虽然第三季度的营收排名第三,但是年成长(YoY)高达55.7%,成长幅度再度夺冠。
超威半导体(AMD)得益于今年在Ryzen、EPYC处理器在市场的佳绩,营收至28.01亿美元,年成长55.5%,紧追英伟达之后。
赛灵思(Xilinx)与戴泺格半导体(Dialog)则是第三季唯二衰退的两家公司,前者依然受到中美贸易摩擦影响,网通领域部门拖累了整体的营收表现。戴泺格半导体则是客制化混合讯号产品线部门年衰退19.6%,导致整体第三季营收仅3.86亿美元。
相比之下,中国台湾的IC设计公司整体表现依然出色,值得一提的是,瑞昱(Realtek)与联咏(Novatek)受惠于客户积极拉货,营收年成长分别为47.9%和40.4%,双双超越美满电子(Marvell),分别拿下第七与第八名,其中瑞昱更紧追在赛灵思(Xilinx)之后,双方营收差距仅为700万美元左右。
可惜的是,如今华为供应链被美国切断,芯片无法继续制造,排名也随之下降,国产芯片巨头华为海思本次排名已经跌出前十名。
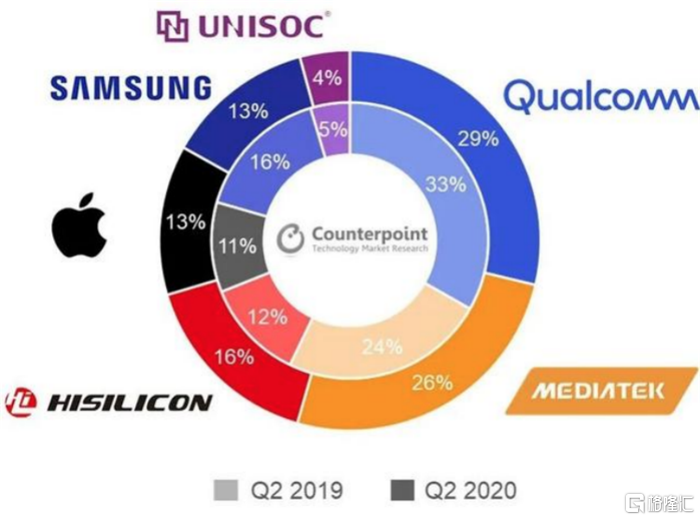
据Counterpoint的数据显示,在2020上半年手机芯片市场中,当时海思还占据了16%的份额,排在第三位。
不过,同为IC设计巨头的联发科,在这一年却是收获满满。第三季度,联发科营收同比大增53.2%,营收更是达到了33亿美元,排名全球第四。
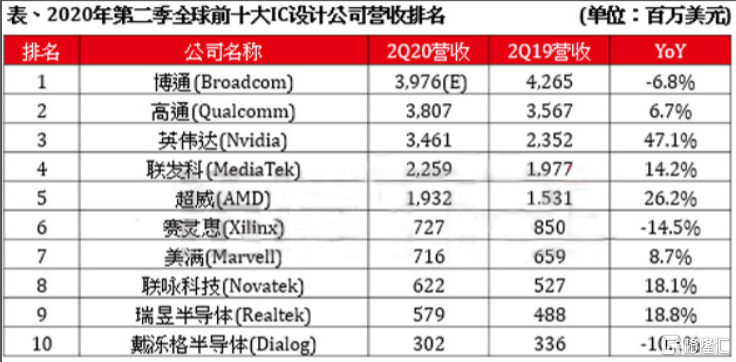
在2020年第二季度全球前10大IC设计厂商营收排名中,与第一季度相比,最大的不同就是榜首易主,博通从高通手中夺回了第一的位置。
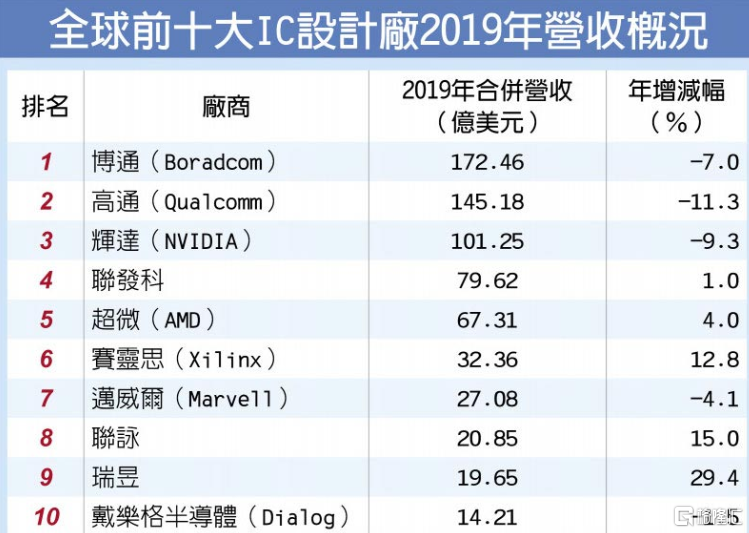
从2019年的全年营收来看,前十大IC设计公司的地位只是略有变动,但是整体的马太效应已经凸显,强者恒强的时代已经到来。
展望2021年,中美贸易摩擦与疫情发展仍然存有变数,晶圆的产能也较为不足,IC设计公司或许会适度涨价,以确保上游晶圆产能正常供给,综观来看,预计明年全球IC设计产业仍会持续成长。
Follow us
Find us on
Facebook,
Twitter ,
Instagram, and
YouTube or frequent updates on all things investing.Have a financial topic you would like to discuss? Head over to the
uSMART Community to share your thoughts and insights about the market! Click the picture below to download and explore uSMART app!

Disclaimers
uSmart Securities Limited (“uSmart”) is based on its internal research and public third party information in preparation of this article. Although uSmart uses its best endeavours to ensure the content of this article is accurate, uSmart does not guarantee the accuracy, timeliness or completeness of the information of this article and is not responsible for any views/opinions/comments in this article. Opinions, forecasts and estimations reflect uSmart’s assessment as of the date of this article and are subject to change. uSmart has no obligation to notify you or anyone of any such changes. You must make independent analysis and judgment on any matters involved in this article. uSmart and any directors, officers, employees or agents of uSmart will not be liable for any loss or damage suffered by any person in reliance on any representation or omission in the content of this article. The content of the article is for reference only and does not constitute any offer, solicitation, recommendation, opinion or guarantee of any securities, virtual assets, financial products or instruments. Regulatory authorities may restrict the trading of virtual asset-related ETFs to only investors who meet specified requirements. Any calculations or images in the article are for illustrative purposes only.
Investment involves risks and the value and income from securities may rise or fall. Past performance is not indicative of future performance. Please carefully consider your personal risk tolerance, and consult independent professional advice if necessary.